A debugger allows you to open up your program while it runs, look at the state, variables, pause and observe the data flow step by step. You can even run code snippets and try ideas in the runtime environment. All that without stopping, changing code (adding console.log!) and restarting. You'll fix issues and understand the codebase much faster with a debugger.
We'll start with some suspiciously simple Node.js code, and in the future will look at debugging a browser app, Express server, GraphQL, TypeScript, Serverless, Jest tests, Storybook - but let's clear the basics first! Even if you're not keen on server-side Node.js, I'd still encourage you to go over this introduction.
Get the code
Git repo for the series: https://github.com/thekarel/debug-anything
The code for our first session is super simple - go ahead and copy-paste it to index.js in an empty folder:
const http = require('http');

const hostname = '127.0.0.1';
const port = 3456;
const serverUrl = `http://${hostname}:${port}`

const server = http.createServer((req, res) => {
  const name = 'World'

  res.statusCode = 200;
  res.setHeader('Content-Type', 'text/plain');
  res.end(`Hello, ${name}!\n`);
});

server.listen(port, hostname, () => {
  console.log(`Server running at ${serverUrl}`);
});
Now go ahead and open the folder in VS Code:
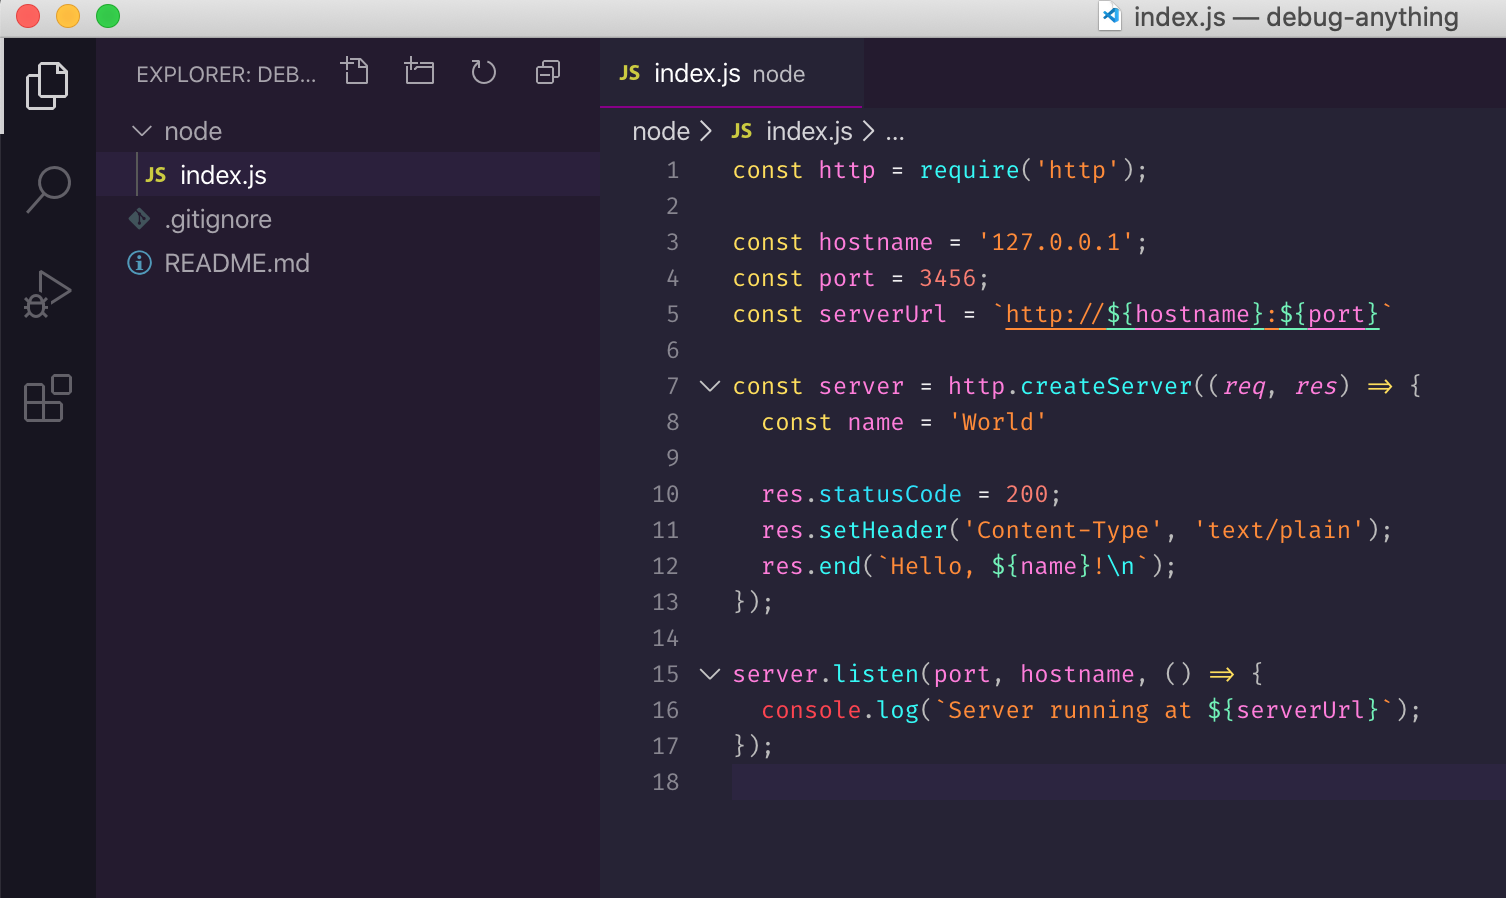
To make sure all is well so far, try to run it:
node index.js
... and visit http://127.0.0.1:3456 - you should see Hello, World!.
Make sure you stop the node index.js command now, or you'll get an ugly Error: listen EADDRINUSE error soon 🙀
The code itself is trivial: we run an HTTP server, and respond to every request with "Hello, World!". Impressive, right? But this simple code is enough to learn the basic notions of debugging.
Add a new feature
Let's add a feature to our server: instead of returning the hard-coded message "Hello, World!", we'll pick the name from the query, so hitting http://127.0.0.1:3456?name=Coco will respond with Hello, Coco!.
Also, let's pretend we have no idea how to do it ;) Wouldn't it be nice to be able to run the server, send a request and see where the name Coco shows up? Let's give it a try. Let's start the debugger!
Start the debugger
Make sure index.js is open in VS Code, click the debugger icon, click Run and Debug then Node.js:
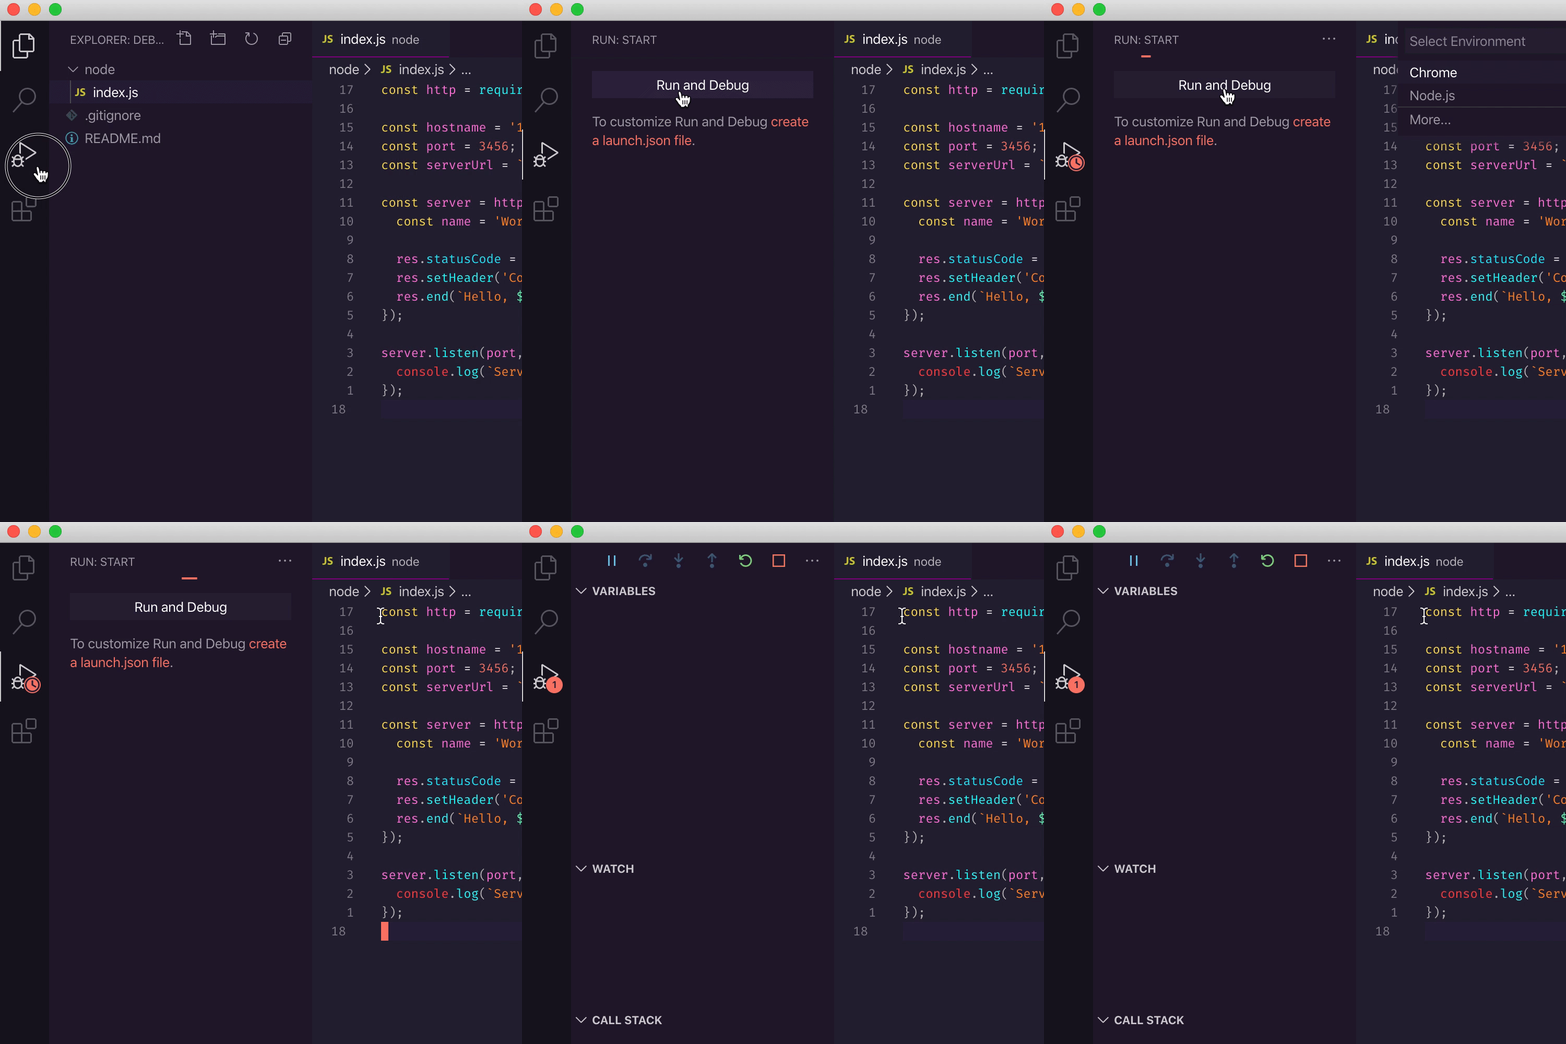
Your server is now running in debug mode! Try visiting http://127.0.0.1:3456?name=Coco - you won't see a difference, but it should still return the default message.
Next, let's add a breakpoint to the code which will pause the execution the next time we hit the server URL. You can do that by clicking the line number in the left gutter of the editor:
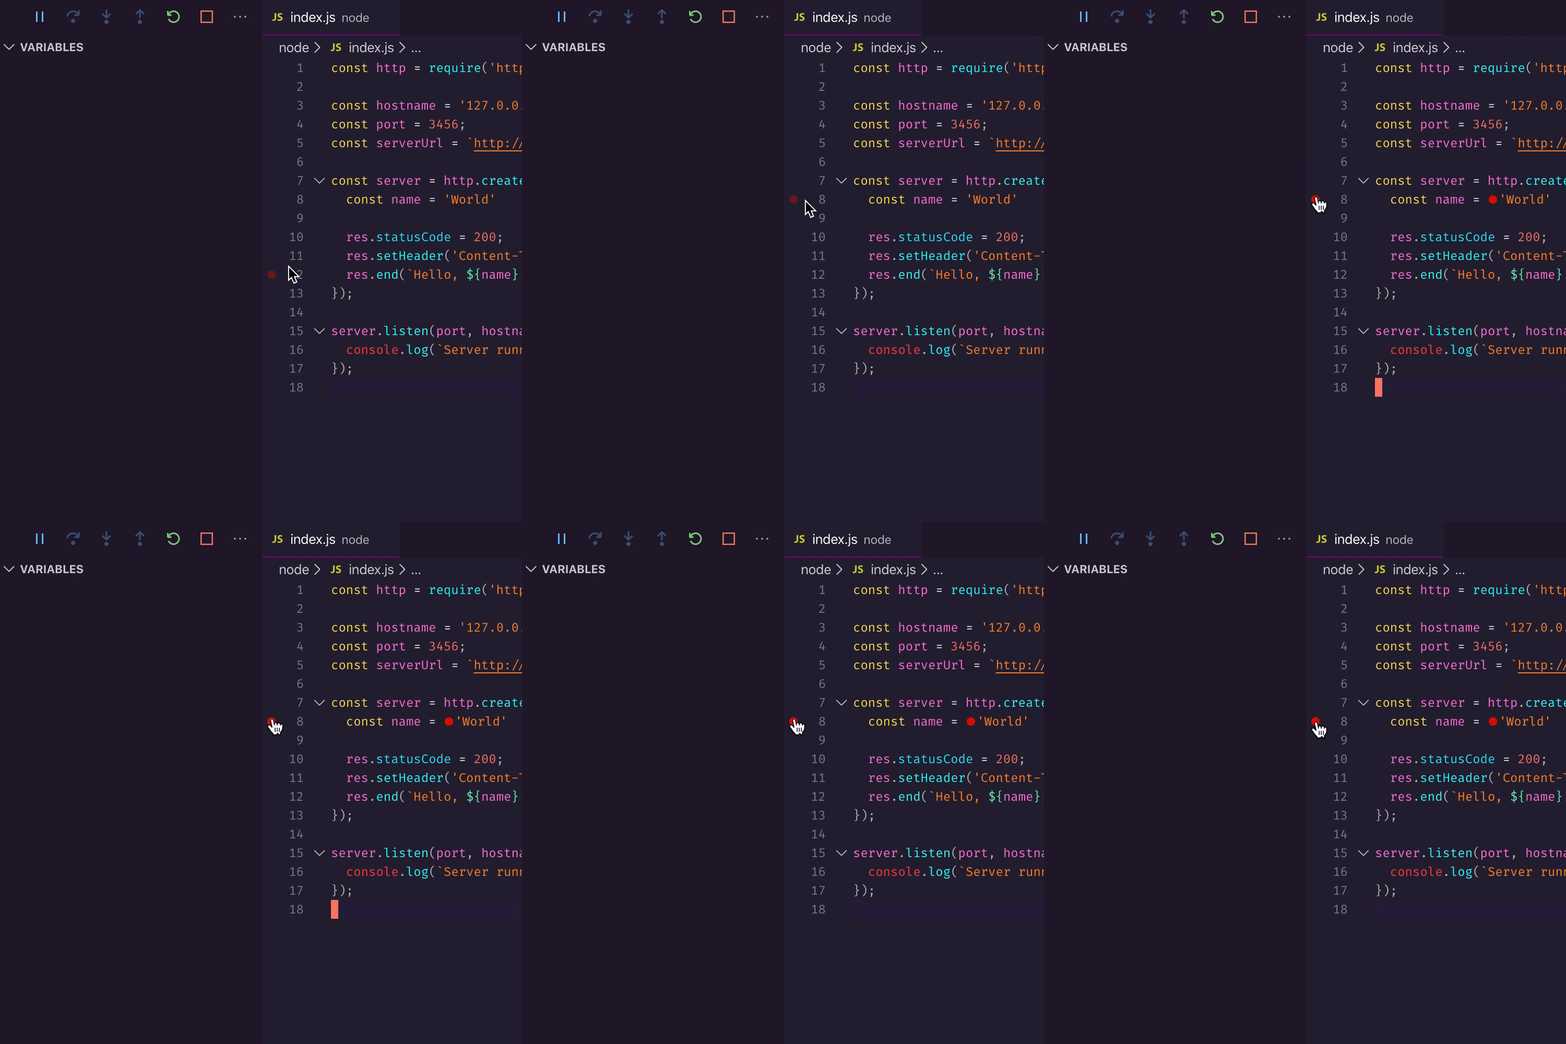
Try visiting http://127.0.0.1:3456?name=Coco - VS Code will pop into view and pause the server:
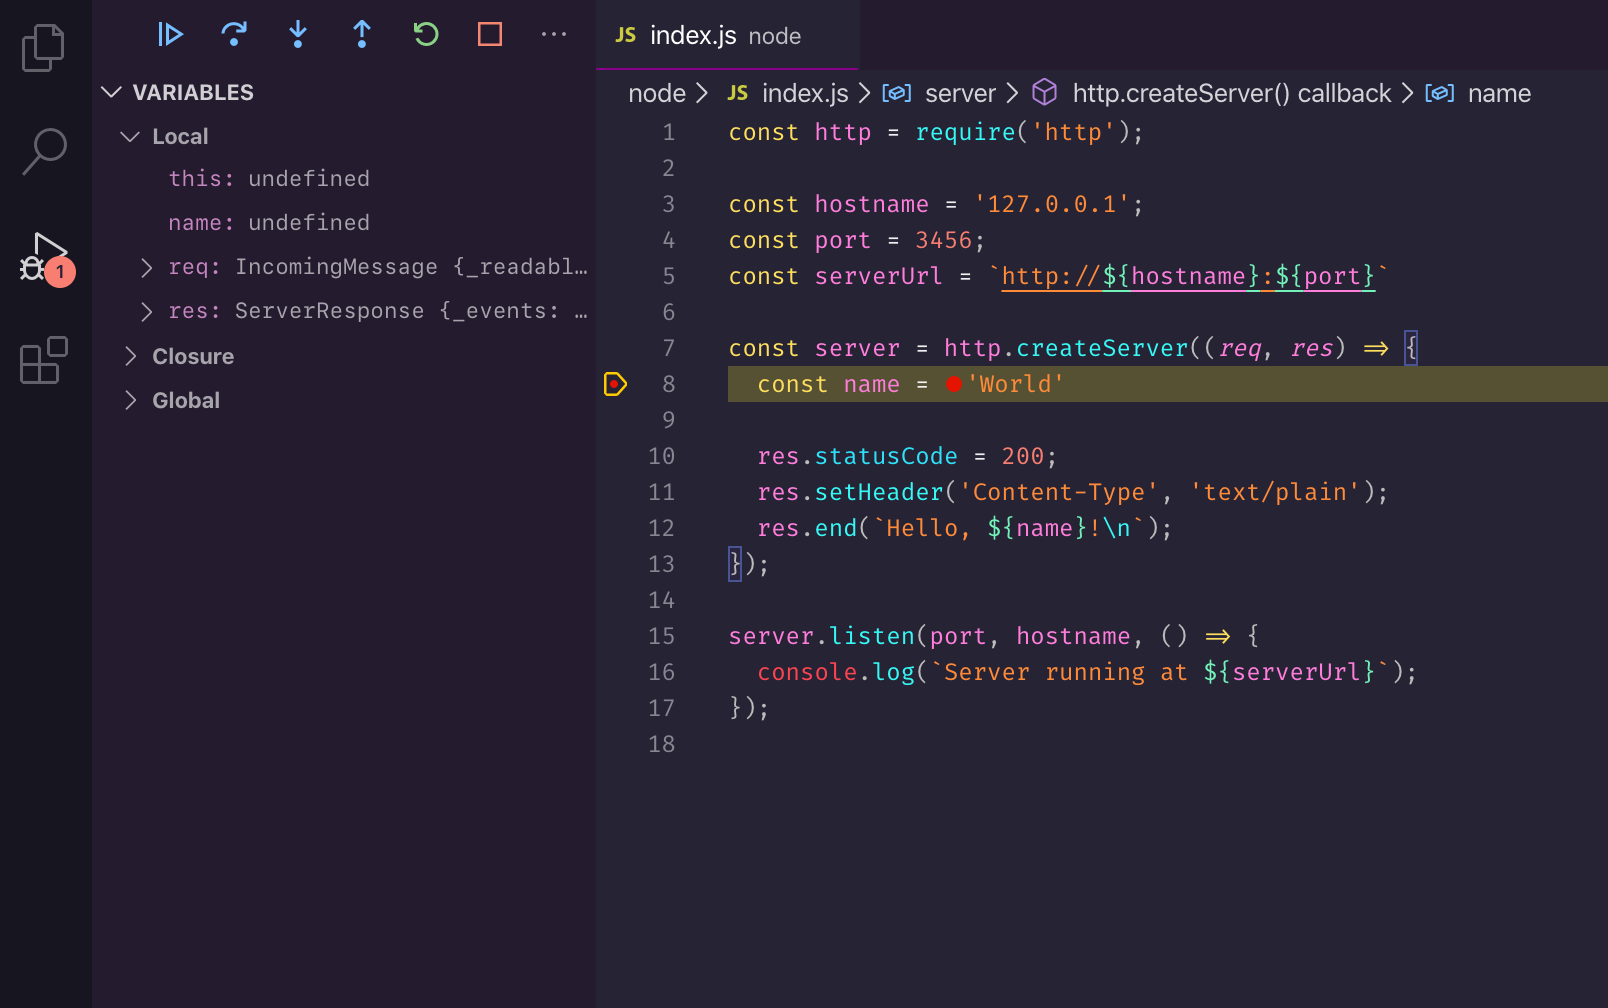
Let's find out where the name in the query ends up, so we can return a friendly greeting. Check out the left sidebar: you'll see a section named Variables. Under Local the IDE shows all the vars that are in the local scope of the function. There's one that looks promising: req:
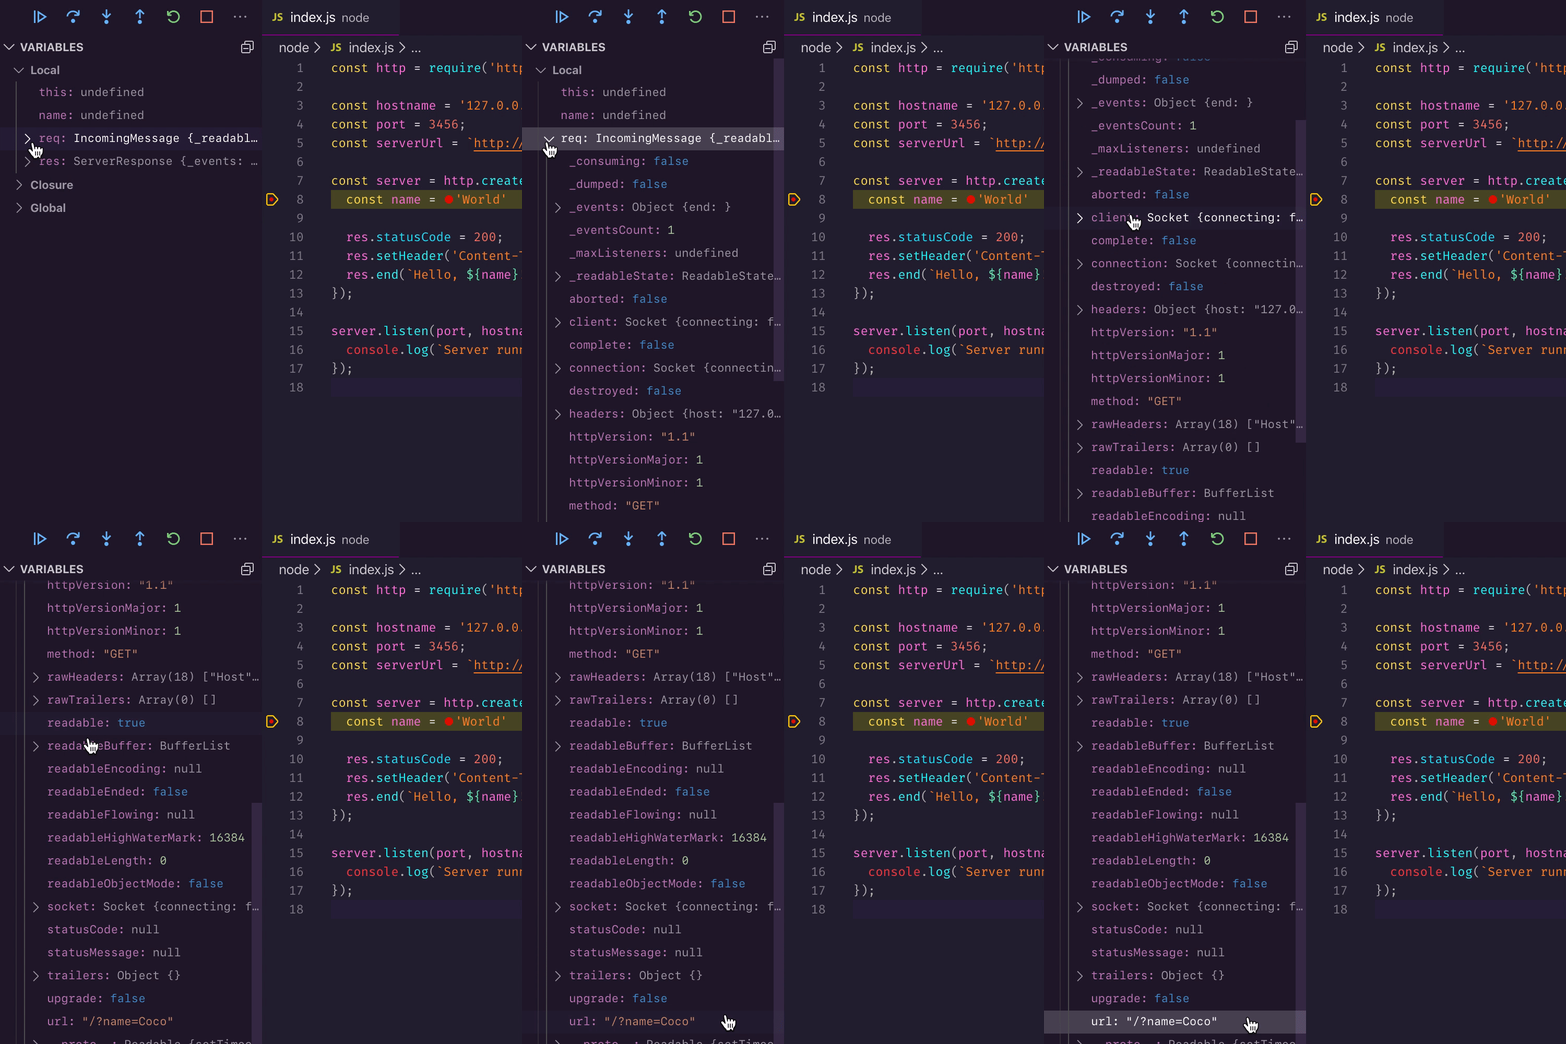
Now that we know that the request query string sits in req.url, with a little help we can go ahead and change the script to
const http = require('http');
const url = require('url'); // 👈

const hostname = '127.0.0.1';
const port = 3456;
const serverUrl = `http://${hostname}:${port}`

const server = http.createServer((req, res) => {
  const {name} = url.parse(req.url, true).query;  // 👈

  res.statusCode = 200;
  res.setHeader('Content-Type', 'text/plain');
  res.end(`Hello, ${name}!\n`);
});

server.listen(port, hostname, () => {
  console.log(`Server running at ${serverUrl}`);
});
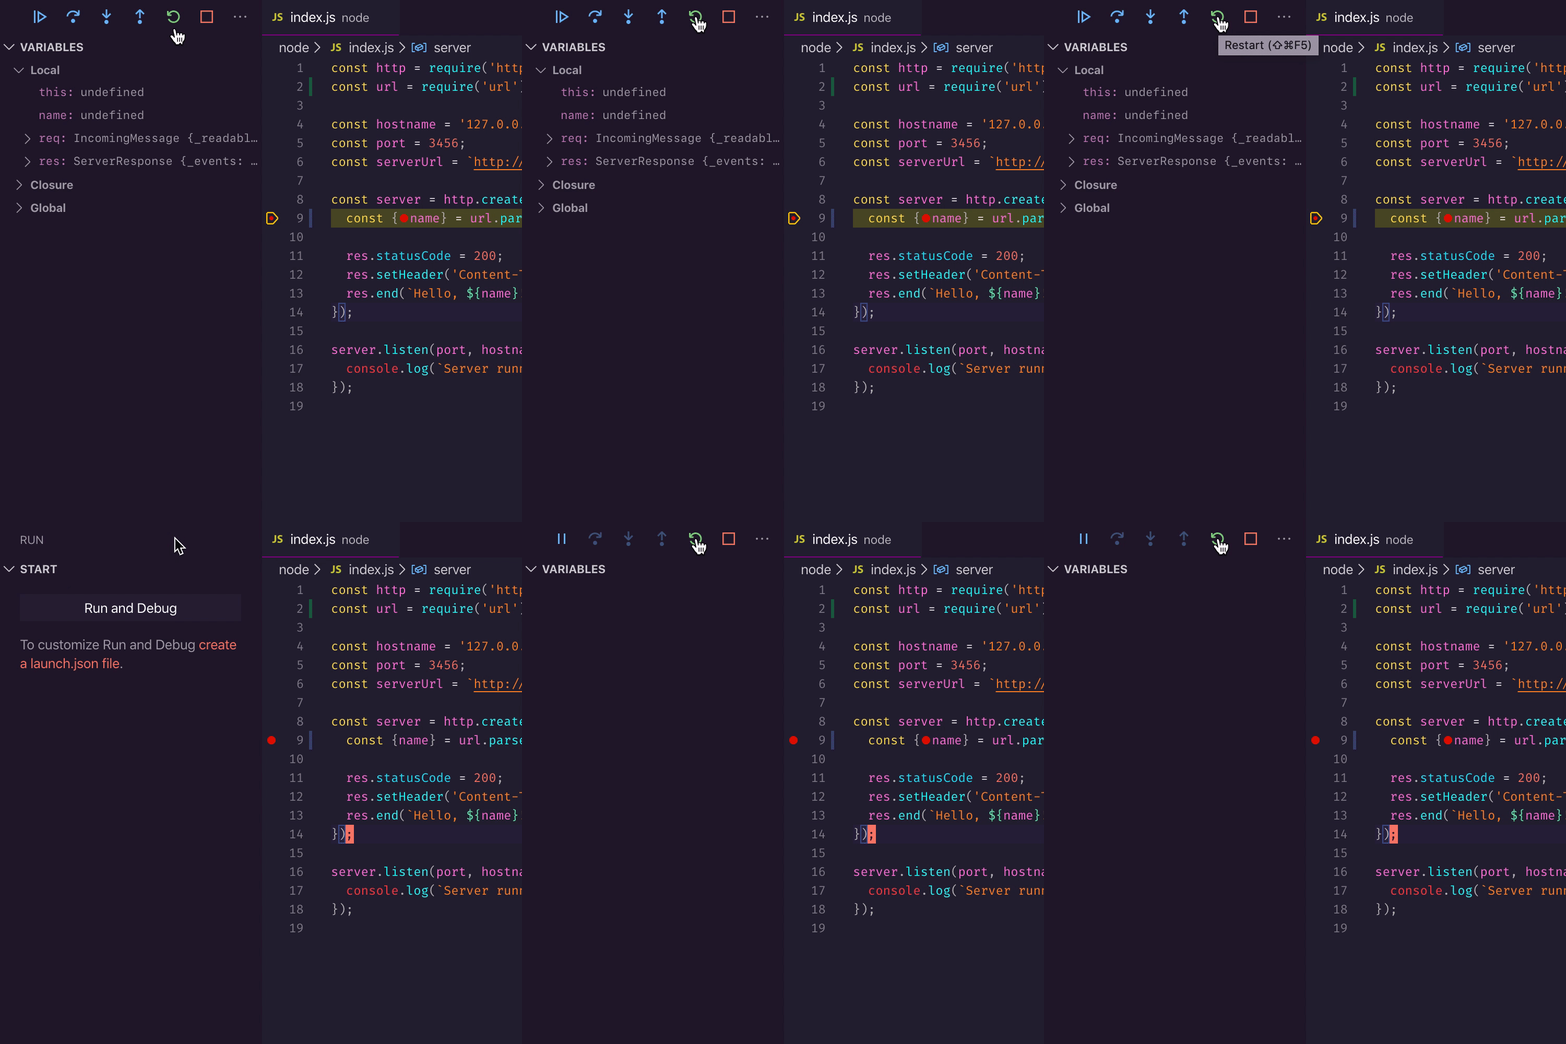
Because the code changed, you need to restart the server. It's simple to do with the debugger: you can press ⇧⌘F5 or click the green restart icon:
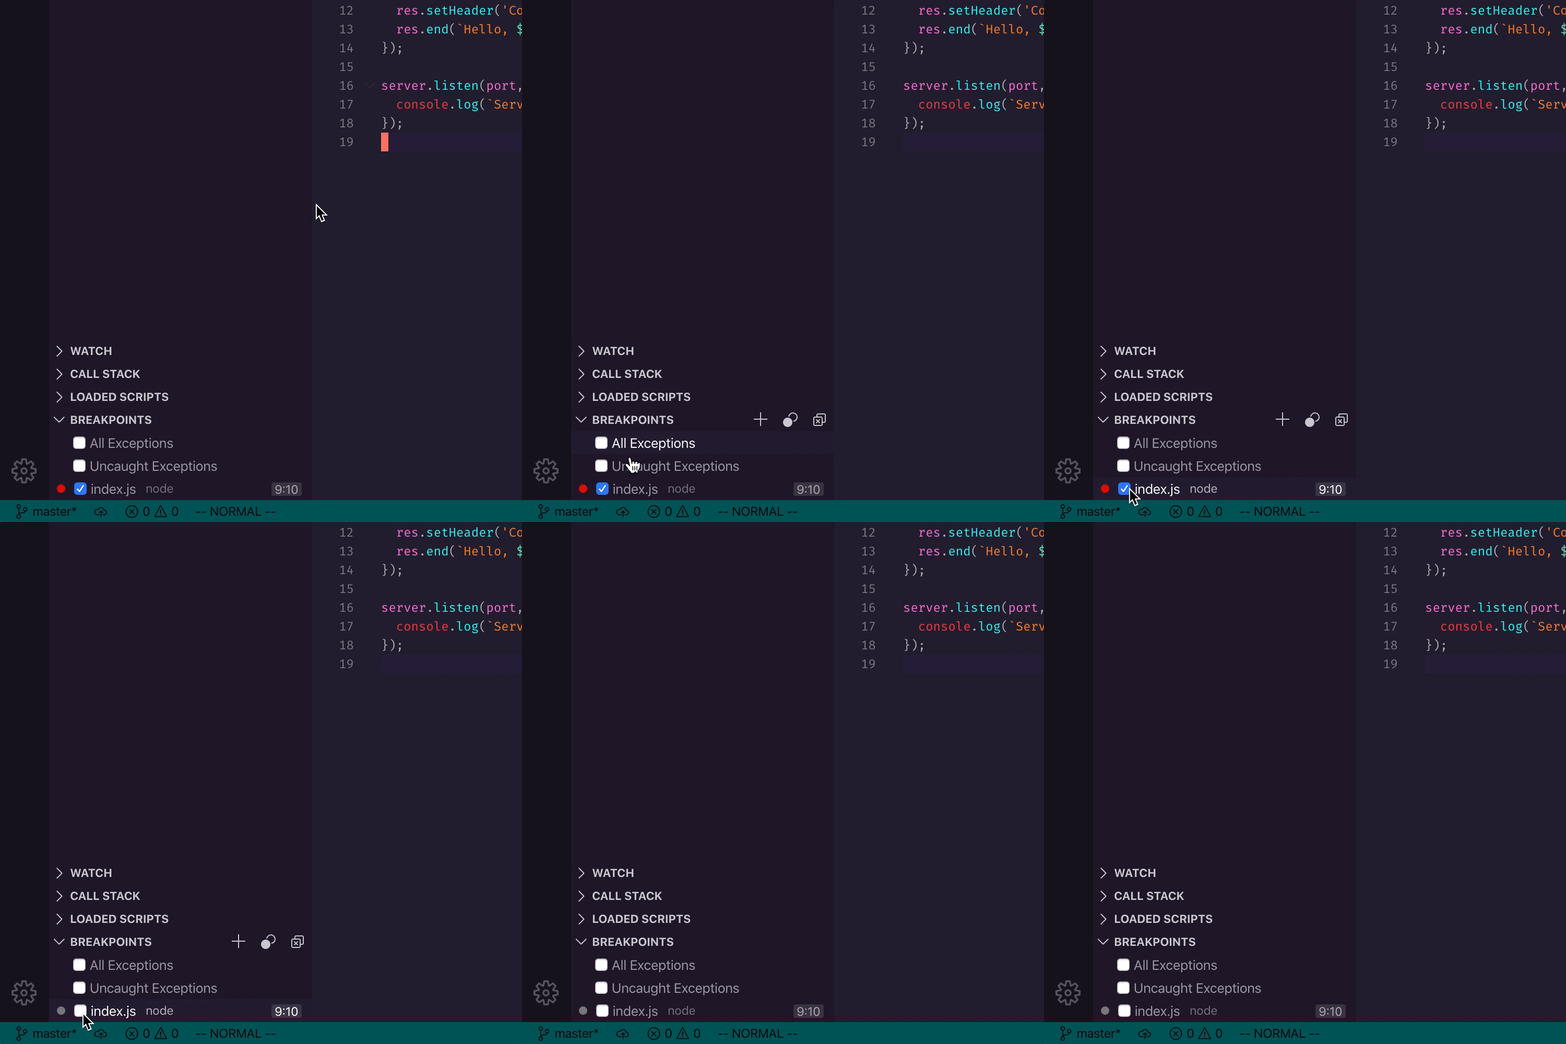
You can also disable the breakpoint as we don't need it anymore:
Visit http://127.0.0.1:3456?name=Coco and marvel at how much one can achieve with today's technology! 😉
I encourage you to keep exploring the debugger. Next time we'll look at walking through the code line by line using the "step over", "step in" and "step out" functionality.
Happy debugging! 🥼